
Seismic Effects on ASTs
Rama Challa Ph.D. P.E, Matrix PDM Engineering, USA, discusses the effects of recent earthquakes on atmospheric storage tanks (ASTs) in Cushing, Oklahoma, with a focus on framing the effects and recommending protocols in an environment of dramatically increasing activity. Read more below or download the PDF here.
According to the US Geological Survey (USGS), the number of earthquakes of magnitude three and larger within the central and eastern US has experienced a 1000 fold increase since 2008, with 858 between 1973 and 2008 and 1570 from 2009 to April 2015. Most of these earthquakes ranged between M3 and M4 – large enough to be felt, but small enough to rarely cause damage. That said, on 10 October 2015, Cushing, Oklahoma, considered the pipeline crossroads of the world, experienced its highest magnitude earthquake to date, an M4.3, raising concern about the impact. In March 2016, USGS indicated the probability of a damage-causing earthquake to be as high as 5 – 10% within the next year in the central and eastern US.
USGS National Seismic Hazard Maps (NSHM) provide the basis for seismic loading incorporated in API 6501 and ASCE 7.2 The current USGS maps do not include recent seismic activities in the central US. There was, therefore, a need to understand the effects of this activity on storage infrastructure. In response, and at the request of a Cushing-based consortium comprised of terminal owner/operators, regulatory authorities, and others, Matrix PDM Engineering performed a limited analysis of the response of a representative tank set3 with the intent to frame the effects. The methodology used an innovative approach to rapidly assess seismic responses based on peak ground accelerations. This article presents the results.
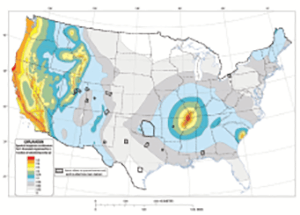
Figure 1. 2% probability of exceedance in 50 years map of one-second spectral response acceleration.6
Background
Aboveground storage tanks in the US are designed using API 650 Annex E and incorporated by reference in regulatory codes. The seismic design consists of an analysis of the structural response to earthquakes and the measures taken to contain that response. Earthquake effects are simulated by applying artificial forces to a mathematical model of a structure, resulting in responses similar to that caused by an earthquake.
The maximum considered earthquake at a location in the US is defined by USGS in the form of NSHMs. These maps express spectral response parameters (Ss, S1) corresponding to ground motions due to a seismic event with a specific probability of exceedance in any given year, or, stated alternatively, with a recurrence interval (Figure 1).
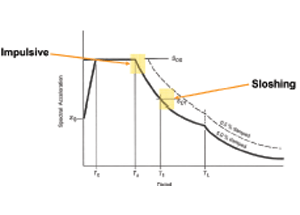
Figure 2. Earthquake response spectrum notation.1
The USGS maps, with the seismic responses or parameters, are derived from a response spectrum associated with the maximum considered earthquake developed probabilistically. A response spectrum is a graph that shows responses of a single degree of freedom system over multiple frequencies for the design earthquake (Figure 2). Building codes, regulatory agencies, and engineering standards set a specific design earthquake based on a consensus assessment of risk and use the parameters associated with that earthquake for structural analysis and design. In ASCE 7 and API 650, USGS maps with a recurrence interval of approximately 2500 years and spectral response acceleration parameters Ss and S1, corresponding to periods of 0.2 sec. and 1 sec., respectively, are used.
Responses of an aboveground storage tank to an earthquake can be broadly divided into two modes: an impulsive mode and a convective mode. The impulsive response results from high-frequency components (Ss) of the ground motion, which cause movement of the tank and a portion of its contents inside. The convective response is caused by the sloshing of the liquid and is affected by the low-frequency components (S1) (Figure 3). Pseudo forces, to mimic the impulsive and convective responses, are calculated using tank and fluid masses using seismic parameters and are applied to a mathematical model of the tank. The responses reviewed in-tank seismic design are lateral stability, dynamic hoop tensile stresses, overturning moment, shell buckling, and sloshing (Figures 4 and 5).
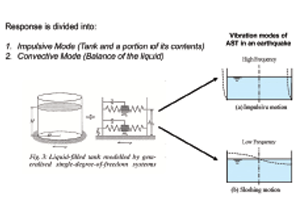
Figure 3. Liquid filled tank modeled by a generalized single degree of freedom systems.7
Typically, earthquakes are defined by magnitudes or by intensities. Structural responses are related to energy released and not to magnitudes. The energy release differs significantly from one earthquake to another. While magnitudes are meaningful in describing severity to the general public, design engineers use seismic parameters (Ss, S1), not magnitudes, in the design process. Hence, there is a need to determine these parameters for the rapid evaluation of the effects due to the occurrence of a seismic event.
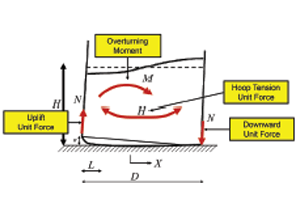
Figure 4. Seismic design process for ASTs; design parameters for an unanchored tank.8
Methodology
If seismic acceleration parameters (Ss, S1) for a probabilistic earthquake in the Cushing area inclusive of the recent seismic activity exist, they can be used for the analysis. Furthermore, if the probabilistic earthquake exists, other methods, such as time history or response spectrum analysis, can also be used to predict the response. In the absence of these parameters, and in order to expeditiously frame the effects, the following approach is used.
At locations that do not have probabilistic response spectra, but have peak ground acceleration (PGA) data, the PGAs can be used to approximately estimate the Ss and S1 values for design per API 650 Appendix E.2 The USGS has a multitude of recording stations throughout the US where recorded PGA data is represented using Shake Maps (Figure 6). If PGAs at a station in the vicinity of tanks are available from these shake maps, they can be used to estimate the values of Ss and S1. This approach is an approximation and has limitations, but can be used as a tool. There is some evidence in the literature4 to indicate that using PGAs directly can over predict the response. For this analysis, the recorded PGA values are reduced by 33%.
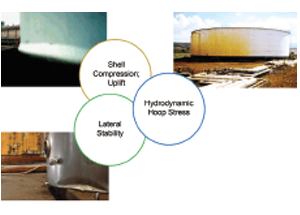
Figure 5. AST design conditions. 7, 9, 10
Results
For analysis of the representative tank set, Matrix PDM reviewed the PGAs recorded at stations around Cushing during the 10 October 2015 (M4.3) earthquake. For this earthquake, two stations were critical. One station recorded a maximum PGA of 13% g at the airport nearest to the tanks; another station at West 9th Street, five miles away, recorded a maximum PGA of 60% g. These were the highest PGAs recorded at these stations among the recent earthquakes. This is logical as the earthquake epicenter was in Cushing. These raw PGAs roughly approximate the response and should be used with caution. Small scale geological differences can significantly change the high-frequency acceleration amplitude and waveform character and cause local focusing and amplification. Per USGS, on certain occasions, but not always, these PGAs are corrected after the event.
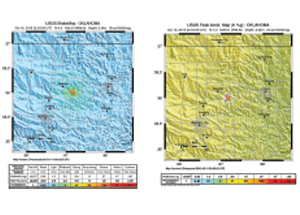
Figure 6. Shake map and peak acceleration map from 10 October 2015.11
A wide range of tank diameters in Cushing were evaluated with regard to the seismic parameters computed from the aforementioned PGAs.3 The tank details used in the evaluation were based on the minimum requirements of API 650. The tanks performed well with the PGA recorded (13% g) at the closest station. For all tank diameters and sizes, the responses computed (lateral stability, dynamic hoop tensile stresses, overturning moment, shell buckling stress, and sloshing) were well within the design norms when subjected to the 13% g PGA. This is supported by the fact that there were no reports of any earthquake-related tank damage in Cushing.
A similar analysis was performed using the 60% g PGA recorded at the West 9th Street station. There was a slight exceedance over the design limit for hydrodynamic hoop stress for larger tanks if the highest PGA recorded (60% g) was used. In addition, the smaller diameter tanks (<100 ft in diameter) may require anchorage. Both of these design limit exceedances were based on staying within API 650 factors of safety with full tanks. Additional analysis was completed to identify the maximum liquid level that would stay within the design limits of API 650 using the 60% g PGA. Trends for guidance are shown in Figure 7.
Methodology
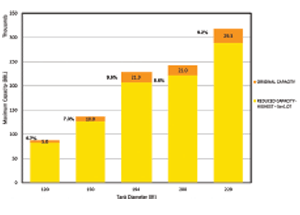
Figure 7. If the highest PGAs recorded are used to compute seismic parameters (48 ft tall) recommended reduction in maximum capacity (liquid level).
If seismic acceleration parameters (Ss, S1) for a probabilistic earthquake in the Cushing area inclusive of the recent seismic activity exist, they can be used for the analysis. Furthermore, if the probabilistic earthquake exists, other methods, such as time history or response spectrum analysis, can also be used to predict the response. In the absence of these parameters, and in order to expeditiously frame the effects, the following approach is used.
At locations that do not have probabilistic response spectra, but have peak ground acceleration (PGA) data, the PGAs can be used to approximately estimate the Ss and S1 values for design per API 650 Appendix E.2 The USGS has a multitude of recording stations throughout the US where recorded PGA data is represented using Shake Maps
(Figure 6). If PGAs at a station in the vicinity of tanks are available from these shake maps, they can be used to estimate the values of Ss and S1. This approach is an approximation and has limitations, but can be used as a tool. There is some evidence in the literature4 to indicate that using PGAs directly can over predict the response. For this analysis, the recorded PGA values are reduced by 33%.
Results
For analysis of the representative tank set, Matrix PDM reviewed the PGAs recorded at stations around Cushing during the 10 October 2015 (M4.3) earthquake. For this earthquake, two stations were critical. One station recorded a maximum PGA of 13% g at the airport nearest to the tanks; another station at West 9th Street, five miles away, recorded a maximum PGA of 60% g. These were the highest PGAs recorded at these stations among the recent earthquakes. This is logical as the earthquake epicenter was in Cushing. These raw PGAs roughly approximate the response and should be used with caution. Small scale geological differences can significantly change the high-frequency acceleration amplitude and waveform character and cause local focusing and amplification. Per USGS, on certain occasions, but not always, these PGAs are corrected after the event.
A wide range of tank diameters in Cushing was evaluated with regard to the seismic parameters computed from the aforementioned PGAs.3 The tank details used in the evaluation were based on the minimum requirements of API 650. The tanks performed well with the PGA recorded (13% g) at the closest station. For all tank diameters and sizes, the responses computed (lateral stability, dynamic hoop tensile stresses, overturning moment, shell buckling stress, and sloshing) were well within the design norms when subjected to the 13% g PGA. This is supported by the fact that there were no reports of any earthquake-related tank damage in Cushing.
A similar analysis was performed using the 60% g PGA recorded at the West 9th Street station. There was a slight exceedance over the design limit for hydrodynamic hoop stress for larger tanks if the highest PGA recorded (60% g) was used. In addition, the smaller diameter tanks (<100 ft in diameter) may require anchorage. Both of these design limit exceedances were based on staying within API 650 factors of safety with full tanks. Additional analysis was completed to identify the maximum liquid level that would stay within the design limits of API 650 using the 60% g PGA. Trends for guidance are shown in Figure 7.
To properly evaluate a specific tank, site-specific and tank specific analysis is required with the PGAs established with the input of seismologists and based on a risk analysis.
While the evaluation performed by Matrix PDM Engineering considered the tanks primarily, areas other than the tank susceptible to secondary effects include piping attached to the tank, rolling ladders on the floating roof, guide poles, floating roof seals, tank foam piping, etc. Additional items in the terminals that are susceptible are piping and piping supports inside buildings; differential movement between piping, connecting structures, and platforms; and connections for stairways and walkways. Methodologies for review of such infrastructure is well documented in lifeline engineering processes.5
Conclusion
In lieu of relying on recorded PGAs, there is a specific need to design for a maximum considered an earthquake, expected PGAs, and seismic parameters for a given site that would cover the latest earthquake activity. Using this data, and as part of earthquake preparedness, terminal operators may proactively identify and, if possible, retrofit vulnerable equipment including tanks, terminal components, pipelines, and support infrastructure. The plans should consider including event-specific terminal operating protocols and post-seismic inspection and repair procedures for tanks, terminals, pipelines, and infrastructure. These reviews and plans should be shared with local first response providers and local regulatory authorities.